Visualization System

BE Operation Visualization System
The BE Operation Visualization System is a product of Benda Engineering.
About Benda Engineering Co., Ltd.
The BE Operation Visualization system aims to manage and optimize production equipment, offering a centralized solution for real-time monitoring of operating status, monitoring electricity consumption, and efficient management of production data. With this system, manufacturing companies can improve equipment operating efficiency while simultaneously reducing energy costs and enabling data-driven decision-making. Specifically, it collects and analyzes detailed operating data and power consumption data from each piece of equipment on the production line in real-time, allowing for the optimization of production processes and preventive maintenance based on this information.
Product specifications
This system uses sensors to monitor the operating status and electricity consumption of production equipment via the web.

Key Features
-
- Real-time
- Real-time monitoring of the operational status of production equipment.
-
- Power consumption conversion
- Monitoring the electricity usage of production equipment.
-
- Production data analysis
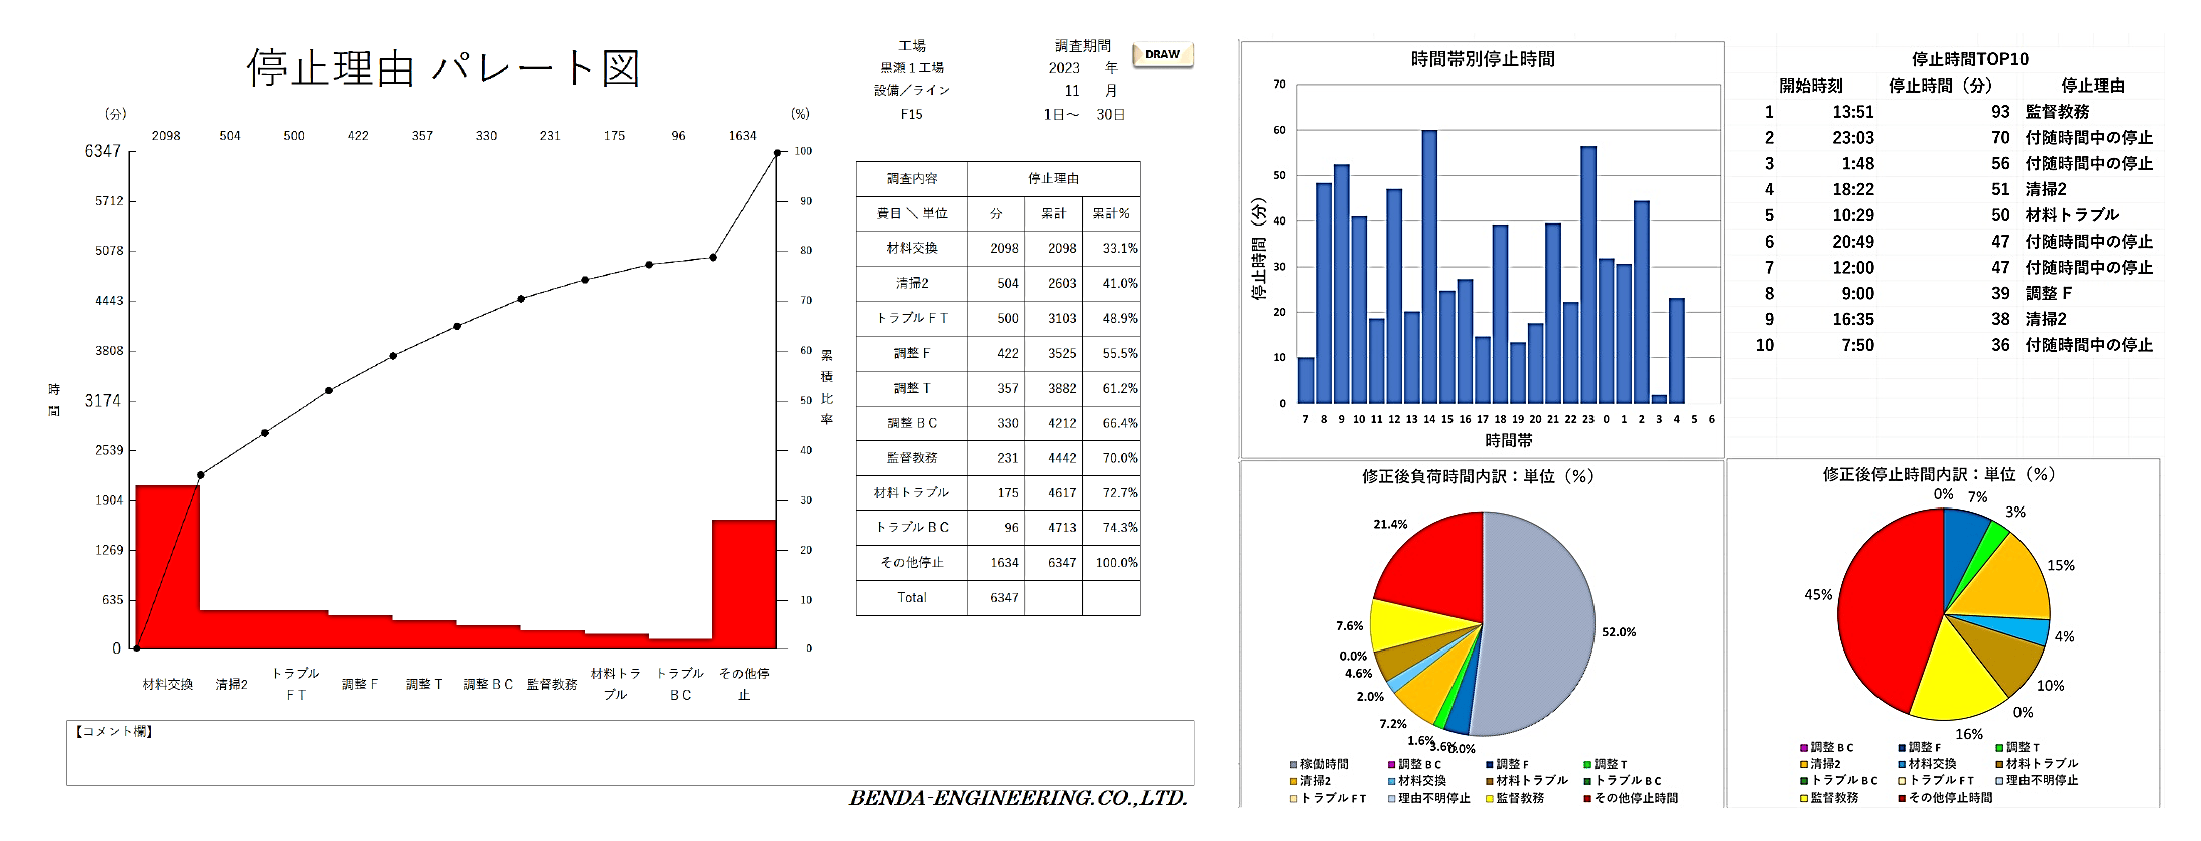
- Analyze the operation, stop, and CT of equipment by item and display the results in graphs.
-
- Remote
- Monitor the status of equipment installed remotely.
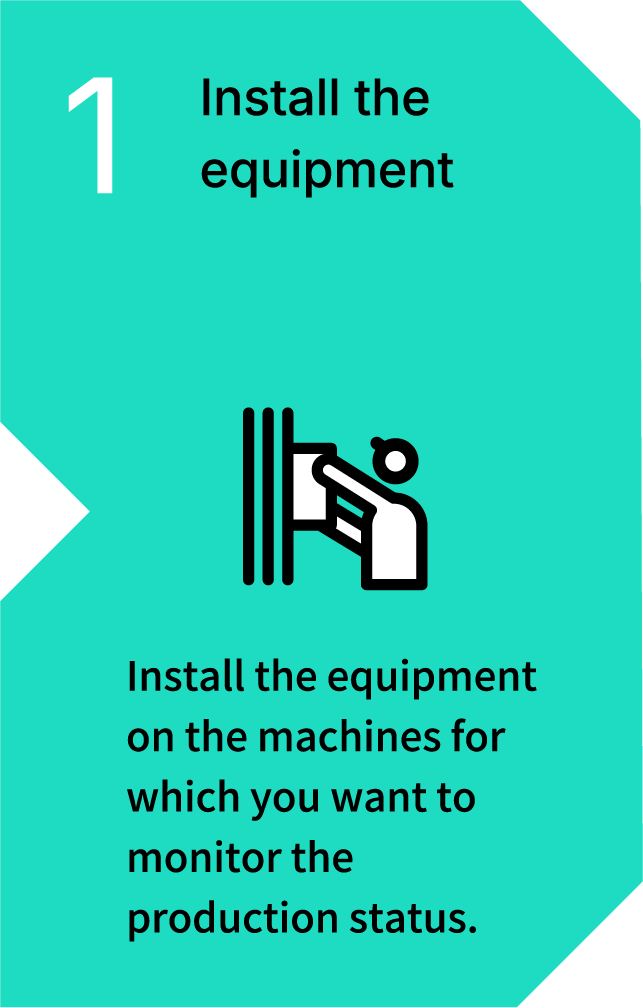
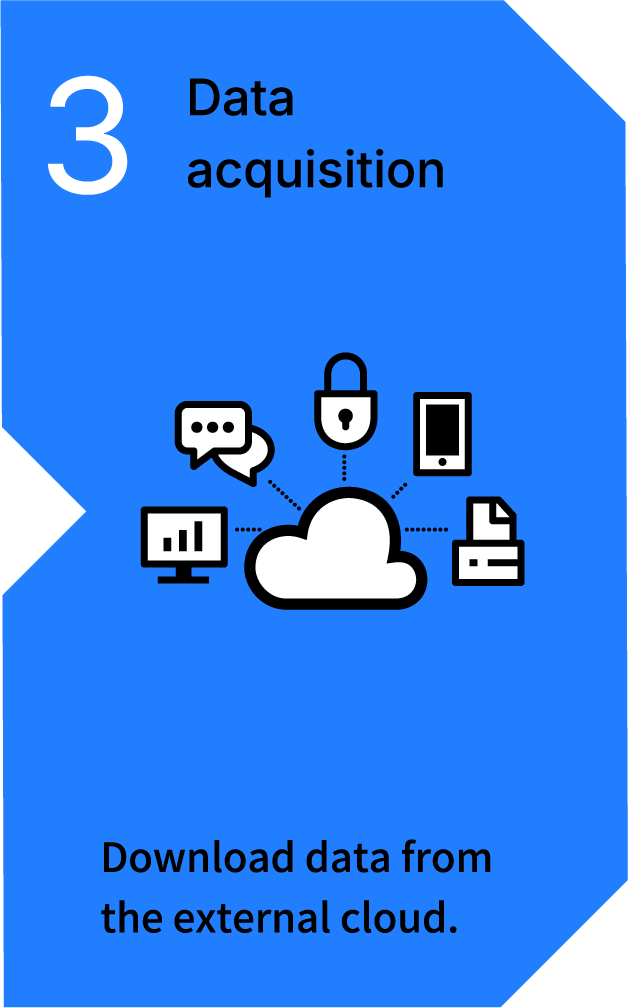
Implementation steps
Our dedicated engineers will support you from sensor and device installation to data confirmation and analysis.

BE Operation Visualization SystemMagnetic / Optical Sensor Type (Standard type)
This is a simple type that only requires attaching sensors to the equipment, allowing the presence/absence of operation and output for each time slot to be visualized on the web. There is no burden on the workers during data acquisition. It can be easily installed even on Showa-era equipment.
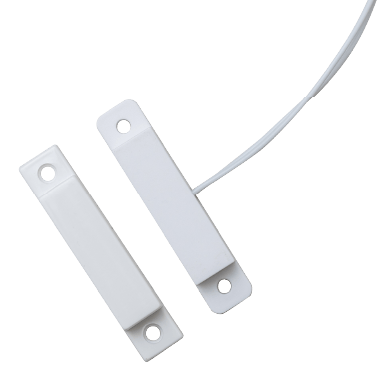 Magnetic Sensor
 Optical Sensor
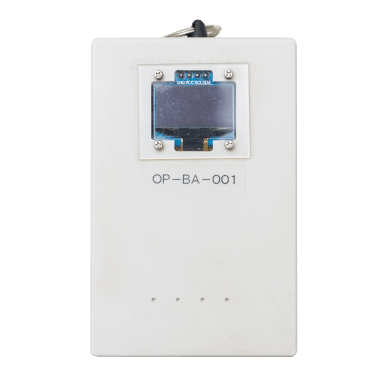 Device
BE Operation Visualization SystemMagnetic / Optical Sensor Type (Stop-reason acquisition type)
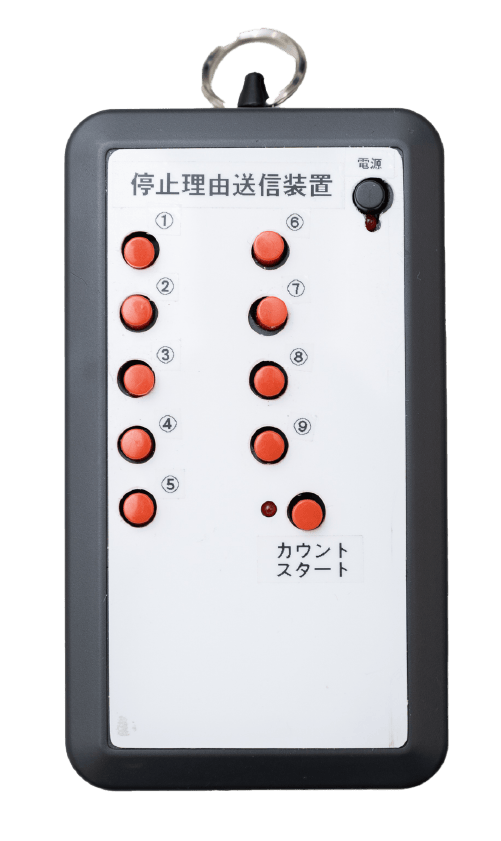
This is an enhanced version of the standard type, featuring an added wireless stoppage reason transmitter. It allows for the acquisition of information on any 9 stop-reasons, making it ideal for investigating the factors that hinder productivity. Additionally, to prevent counting adjustments or idle operations during downtime, it enables the acquisition of highly accurate production numbers.
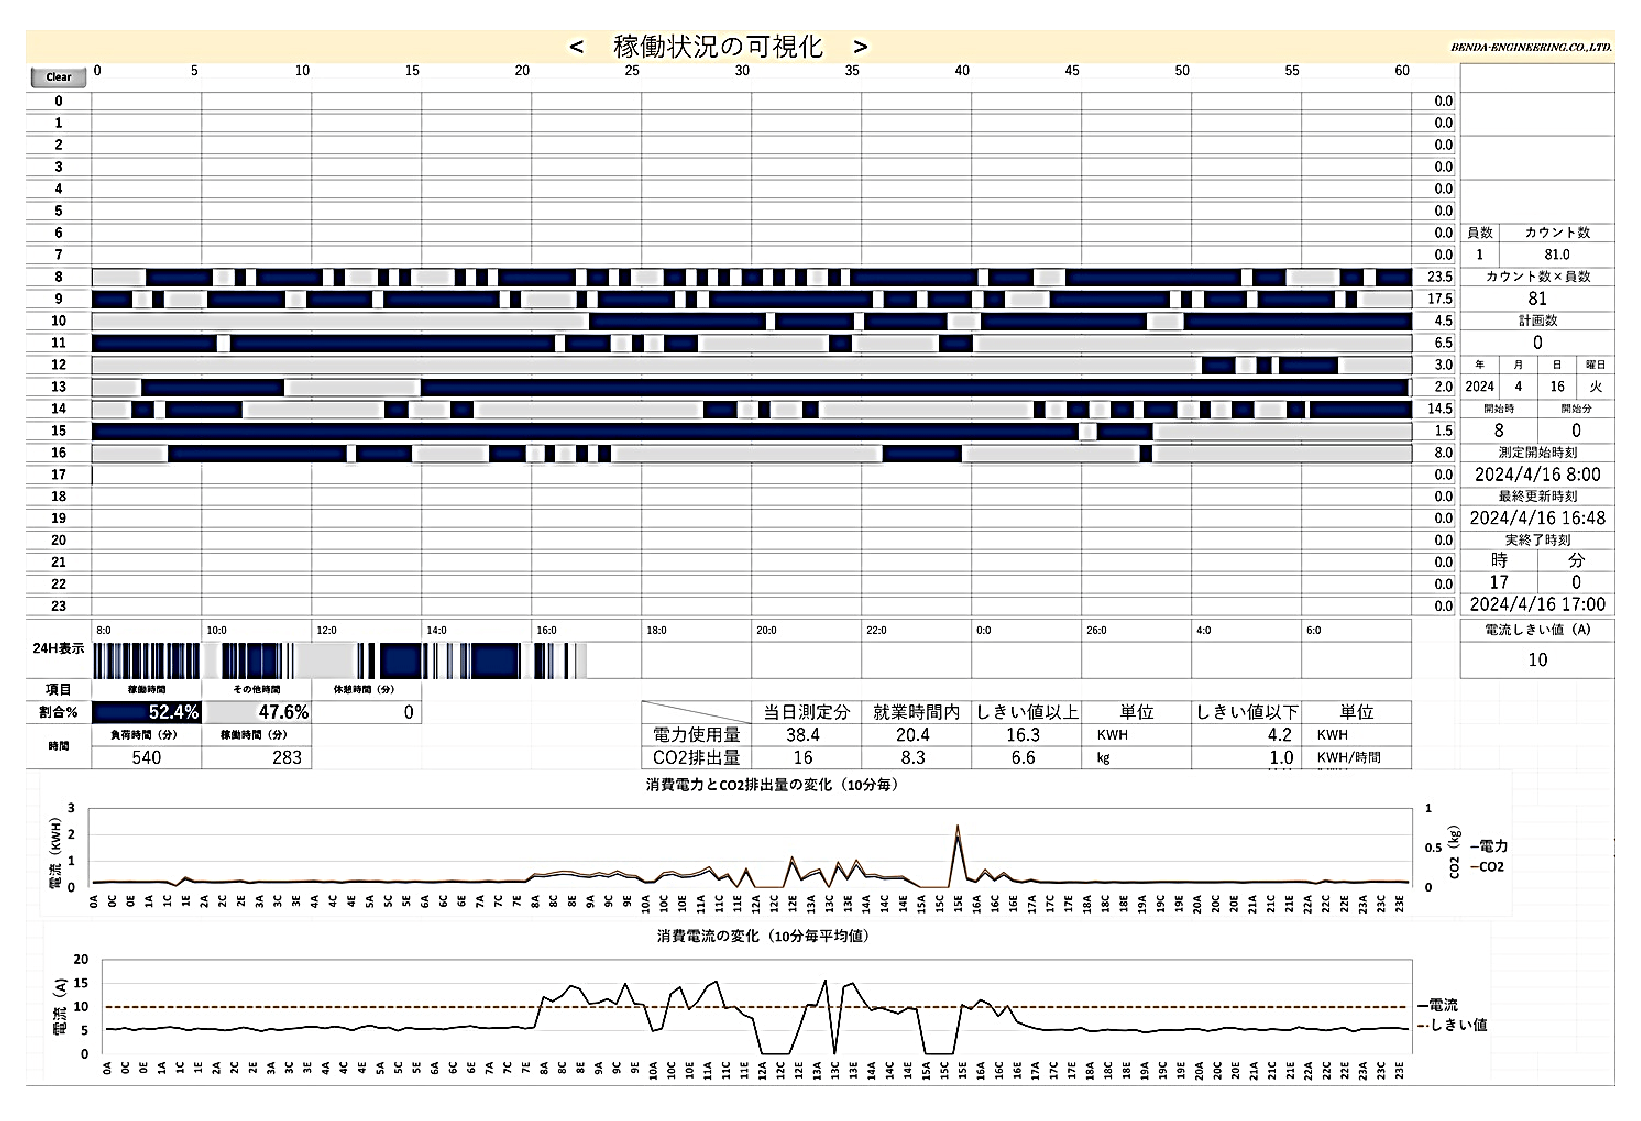
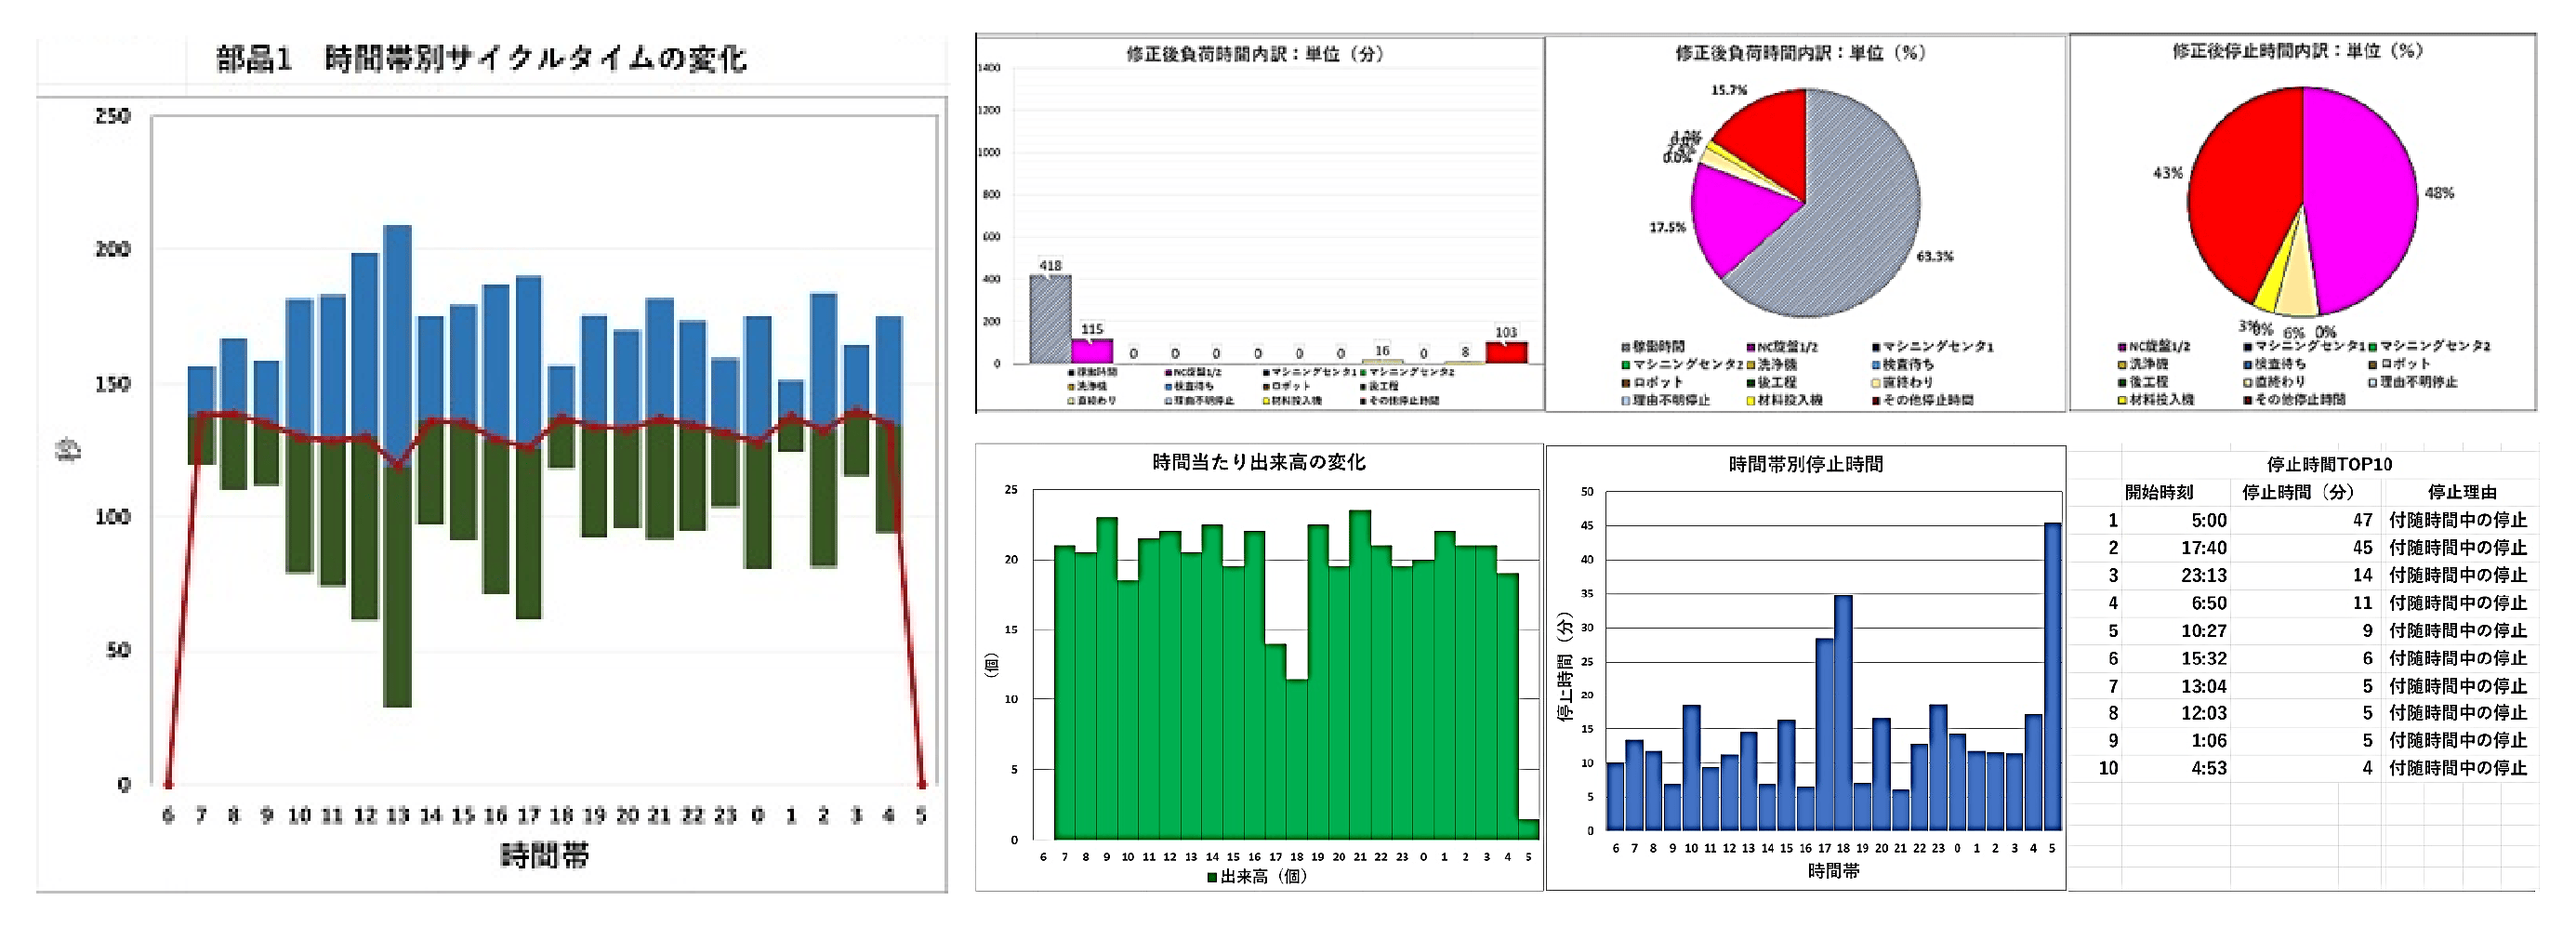
BE Operation Visualization SystemMagnetic / Optical Sensor Type Dedicated Software
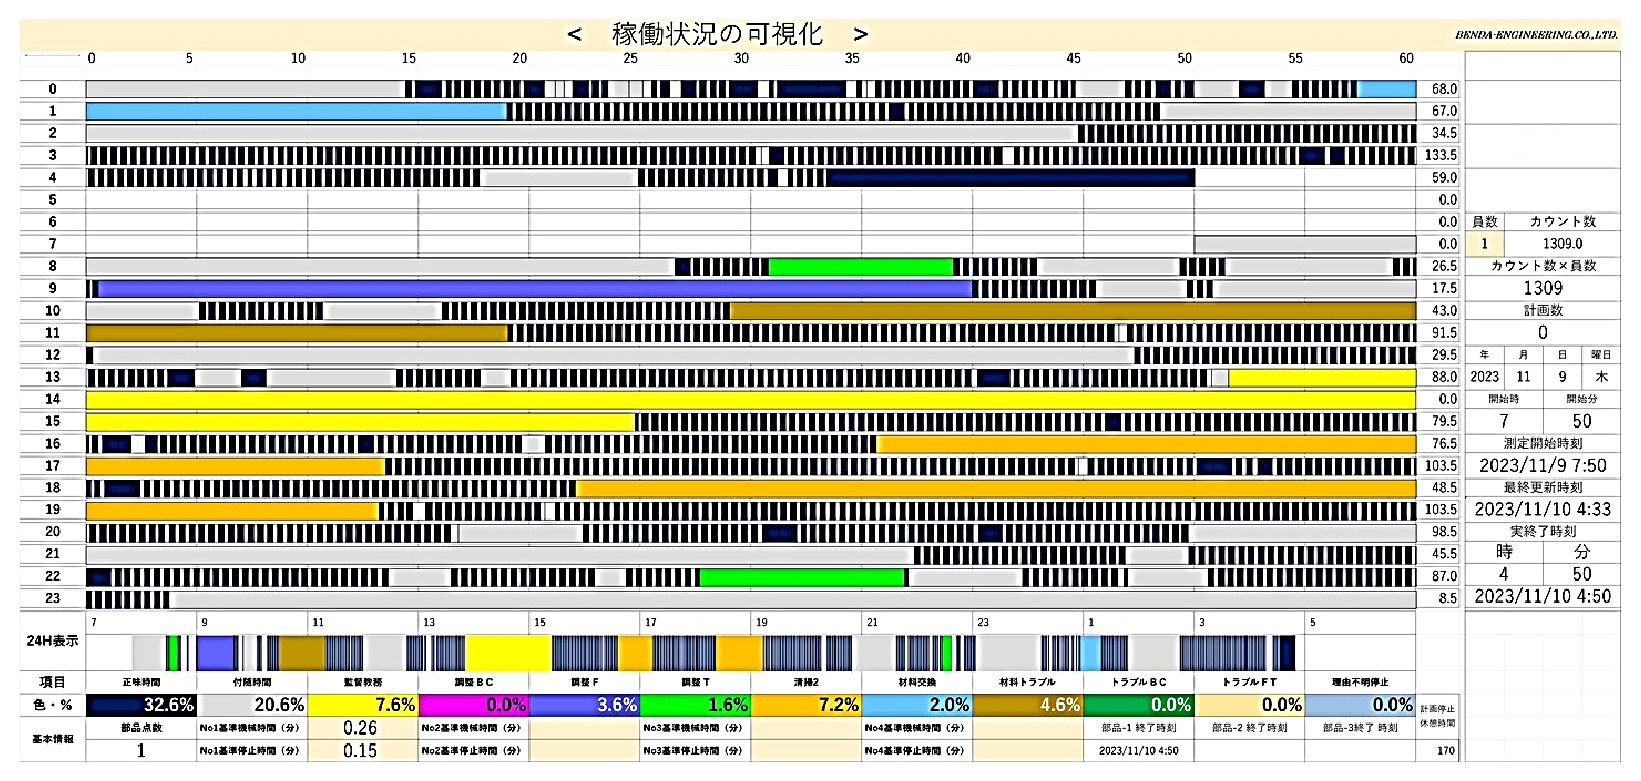
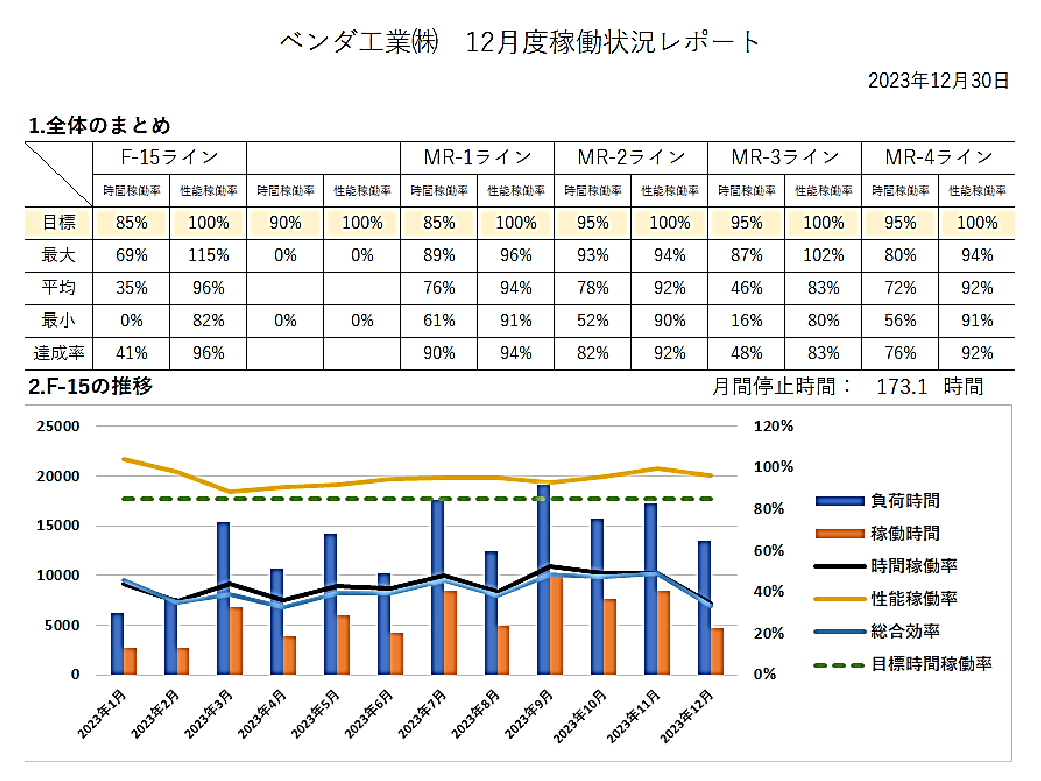
By analyzing the acquired data with dedicated software, the daily operating status can be visualized in detail, and automatic calculations of time utilization rate, performance utilization rate, hourly output, and more can be performed. By comparing these with benchmarks, inefficiencies are revealed, enabling efficient improvements.
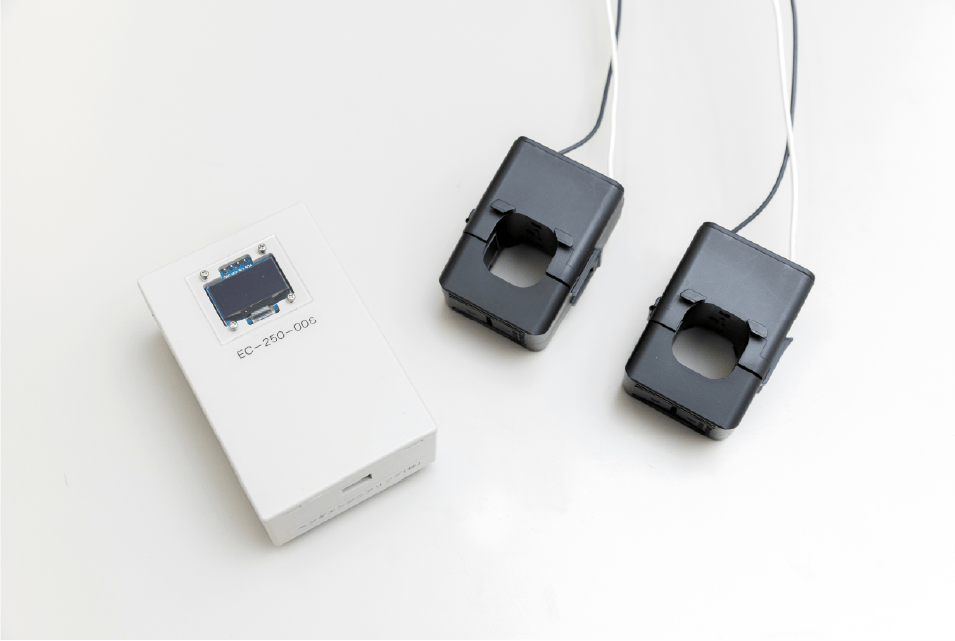
BE Operation Visualization SystemCurrent Sensor Type
By installing a current sensors, the equipment's power consumption is measured. The measurement data is visualized on the web, allowing for a detailed understanding of the equipment's power consumption. CO2 emissions can be calculated from the measurement data and the coefficients provided by the electricity provider.
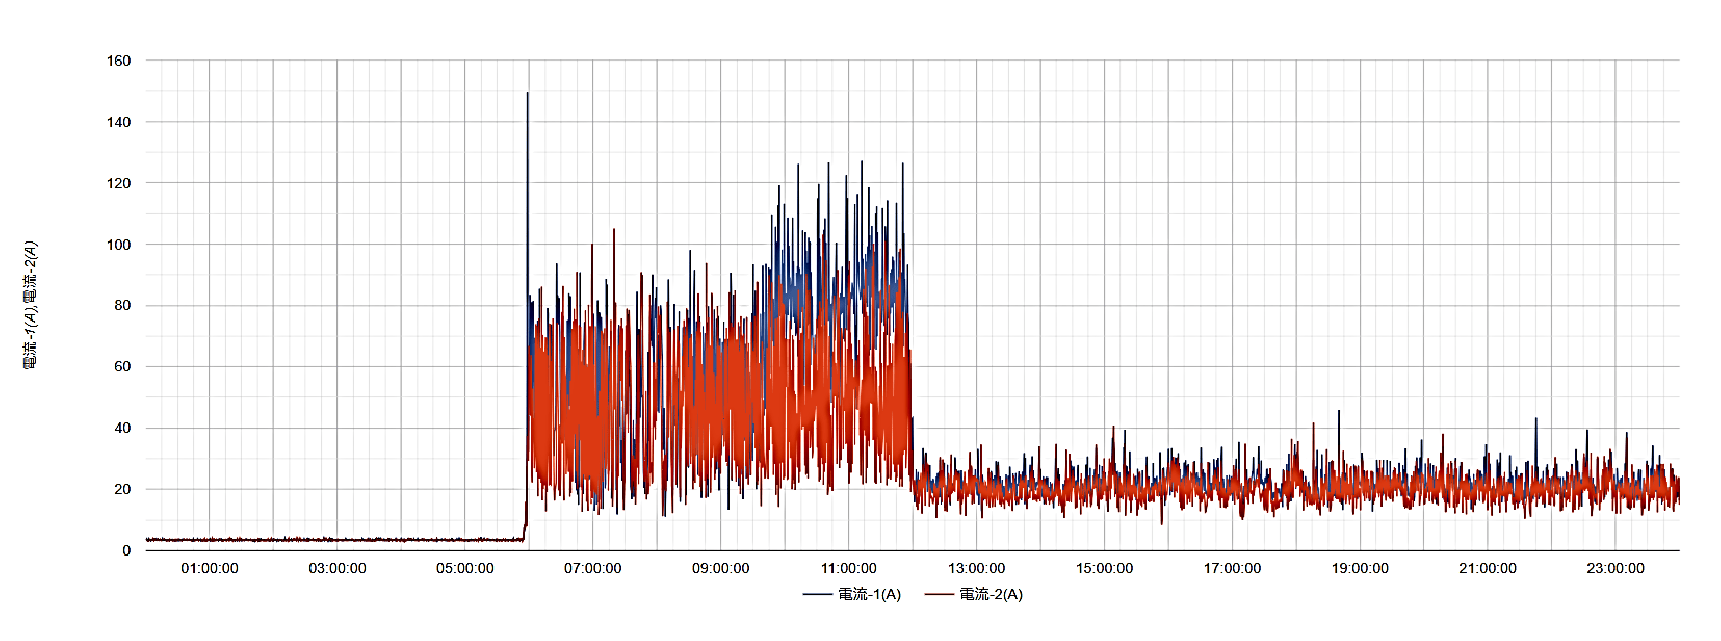
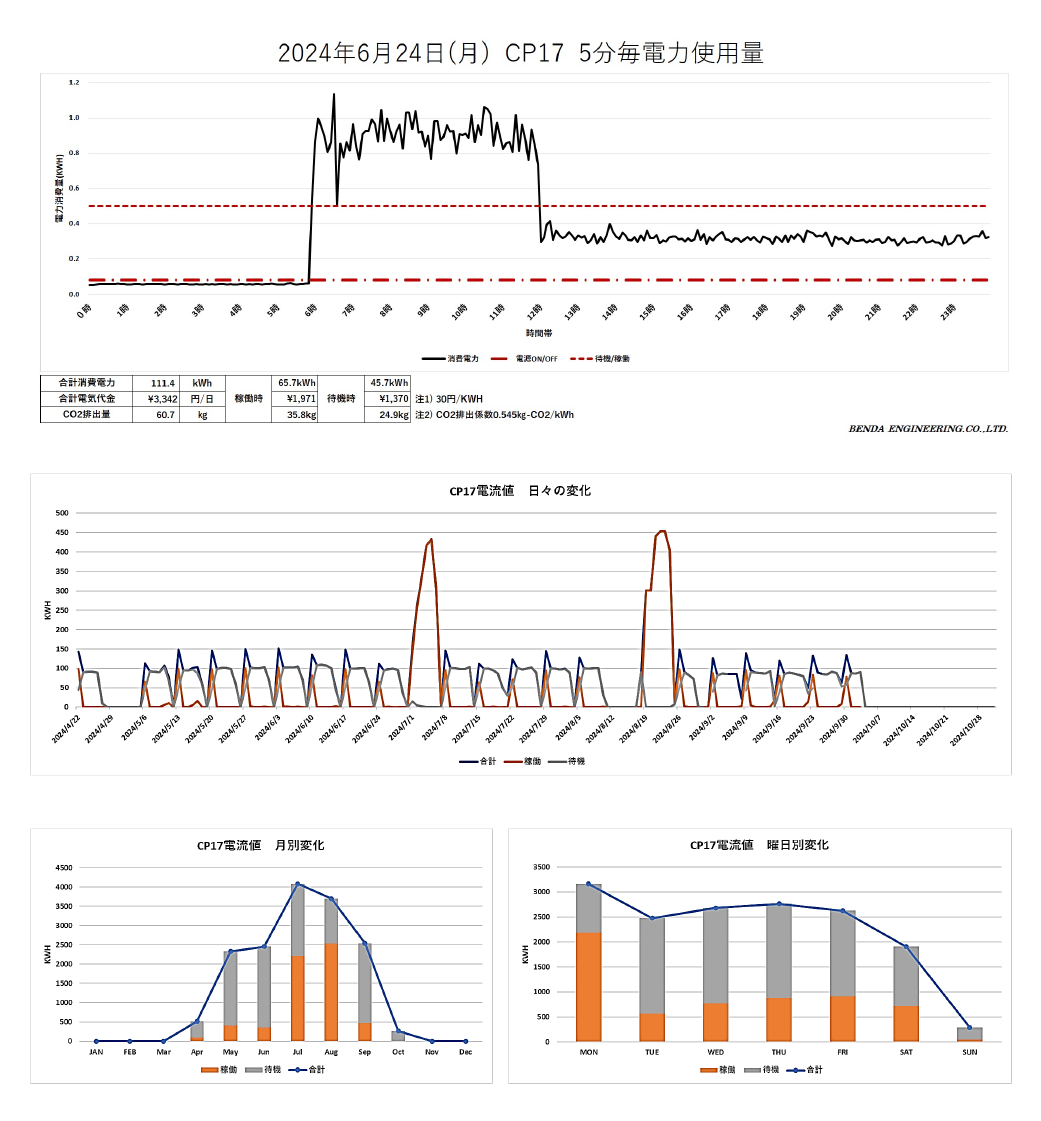
BE Operation Visualization SystemCurrent Sensor Type Dedicated Software
The changes in daily power consumption (= CO2 emissions) can be determined from the acquired data. Analyzing daily, weekly, and monthly aggregations can lead to new insights (and identify issues). Setting thresholds allows for the visualization of operational status as well.